


M. Giovannozzi
INFN and University of Bologna
Via Irnerio 46, 40126 Bologna
Italy3mm
W. Scandale
CERN, SL division, 1211 Geneva Switzerland3mm
E. Todesco
INFN and University of Bologna
Via Irnerio 46,
40126 Bologna
Italy3mm
Dear S. Y. Lee,
we would like to draw your attention to a method of interpolating survival plots that seems to provide reliable predictions of long-term stability in hadron colliders through a simple analytical formula.
We denote by x and y the transverse coordinates of the single-particle undergoing betatron oscillations. A typical survival plot is obtained by tracking initial conditions along the line A=x=y, fixing the momenta to zero, and plotting the number of turns where the particle is lost versus the amplitude A. The resulting pattern is in general rather irregular, and an interpolation of it was considered too hard, if not questionable. In order to identify more precisely the stability boundary, we computed the dynamic aperture using the method given in Ref. [1]. This procedure is based on a weighted averaging of the stability boundary computed along several radial directions of the (x,y) space.
The resulting shape of the survival plots turns out to be much smoother
[2]. The striking fact is that the dynamic aperture D(N) for a
given value of the number of turns N is very well interpolated by the
simple formula
![]()
The constant ![]() provides the dynamic aperture estimate for an
infinite number of turns, and the constant b indicates the reduction rate
of the stability boundary with N.
provides the dynamic aperture estimate for an
infinite number of turns, and the constant b indicates the reduction rate
of the stability boundary with N.
We analysed 4D and 6D motion both in simplified cases based on nonlinear
maps and in realistic LHC models with random and systematic nonlinear
field-shape errors of the order of a few units in ![]() . All the
tracking data are in excellent agreement with the inverse logarithmic
interpolation. Examples of simulations carried out for
the 4D LHC model are given in Figs. 1 and 2. In Fig. 1 we show the survival
plot computed along the x=y diagonal, which features a rather irregular
behaviour. In Fig. 2 we show the same case using the weigthed average along
nine radial directions in the x,y space; the solid line is the
interpolation using Eq. 1, and the dotted line is the estimated dynamic
aperture for infinite times
. All the
tracking data are in excellent agreement with the inverse logarithmic
interpolation. Examples of simulations carried out for
the 4D LHC model are given in Figs. 1 and 2. In Fig. 1 we show the survival
plot computed along the x=y diagonal, which features a rather irregular
behaviour. In Fig. 2 we show the same case using the weigthed average along
nine radial directions in the x,y space; the solid line is the
interpolation using Eq. 1, and the dotted line is the estimated dynamic
aperture for infinite times
![]() .
.
Finally, we would like to point out the formal analogy of our formula with the Nekhoroshev exponential bound to the stability region. More details are given in Ref. [2].
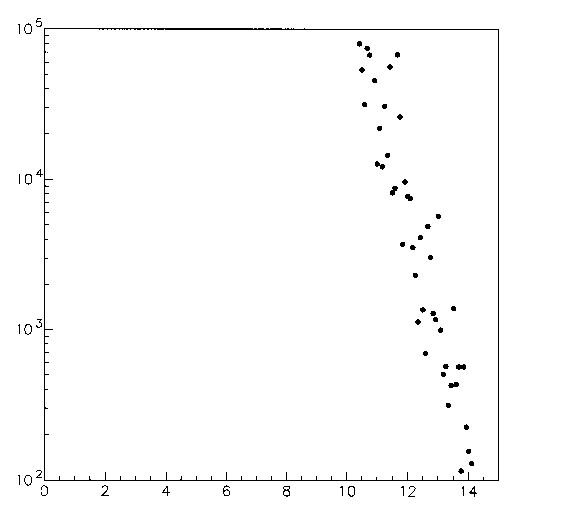
Figure 2.1: Survival plot for a 4D LHC model.
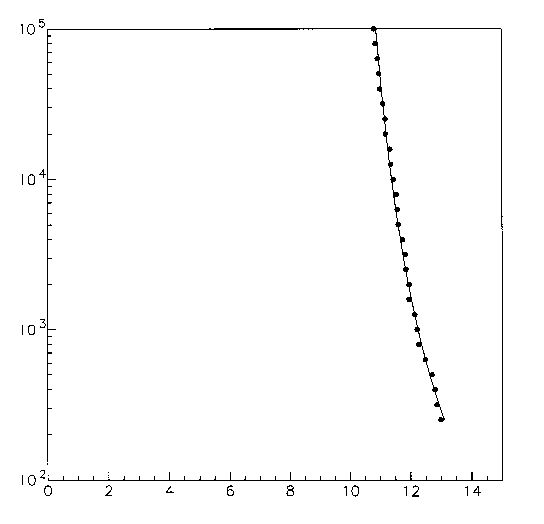
Figure 2.2: Dynamic aperture evaluated through the averaging procedure
for a 4D LHC model (dots); interpolation through the inverse logarithmic
law (solid line) and related asymptotic value for the dynamic aperture
at infinite number of turns (dotted line).